The climate data, that is released to the public is manipulated and visually misleading, to support an alarming warming trend narrative. Each year is “the warmest on record”
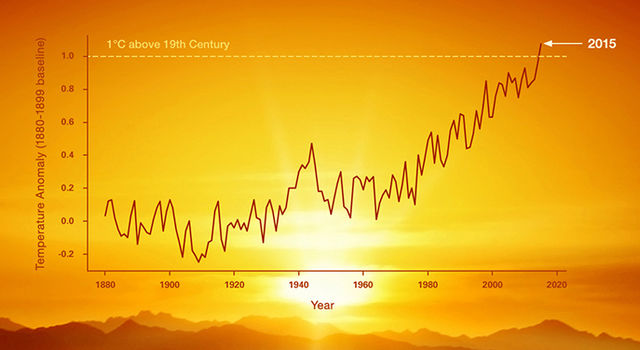
Global Surface Temperature Trend 1880 – 2020
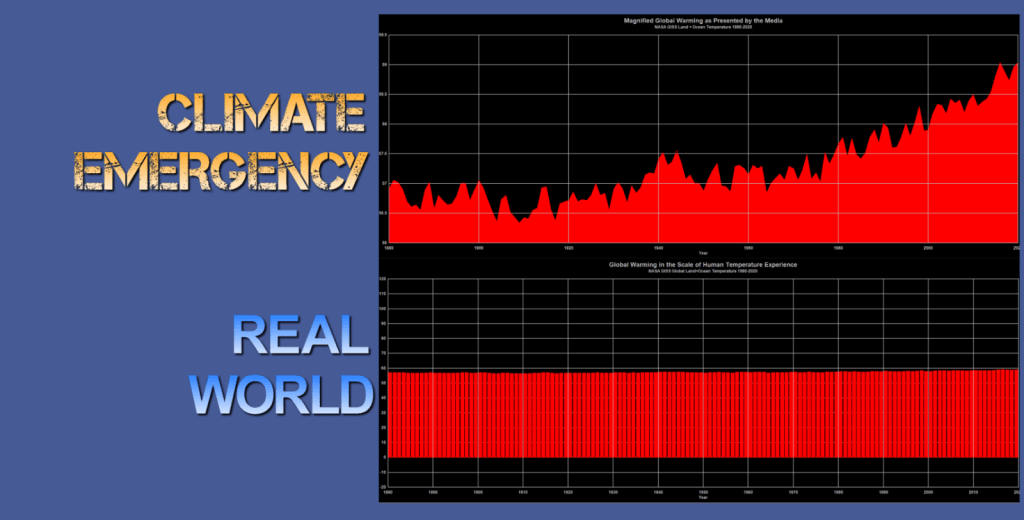
The top graph is magnified to a small temperature range, that is reported by the media. The bottom is the same data, presented in an absolute temperature. The bottom graph does show a miniscule increase – the reader may need a magnifying glass, or a microscope to see it – that’s the “existential threat”, we are facing.
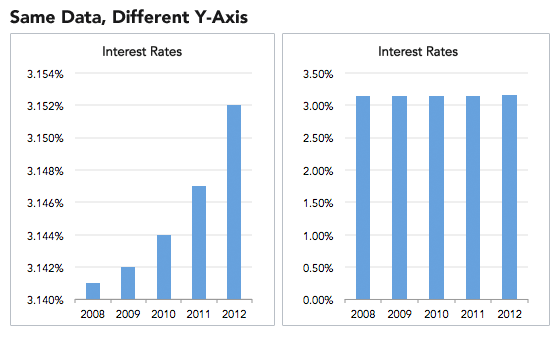
This is a classic technique in manipulating charts. The Y axis should start with 0, if not, a minor change can be turned into a massive increase. Below is an example, the two charts show the same data:
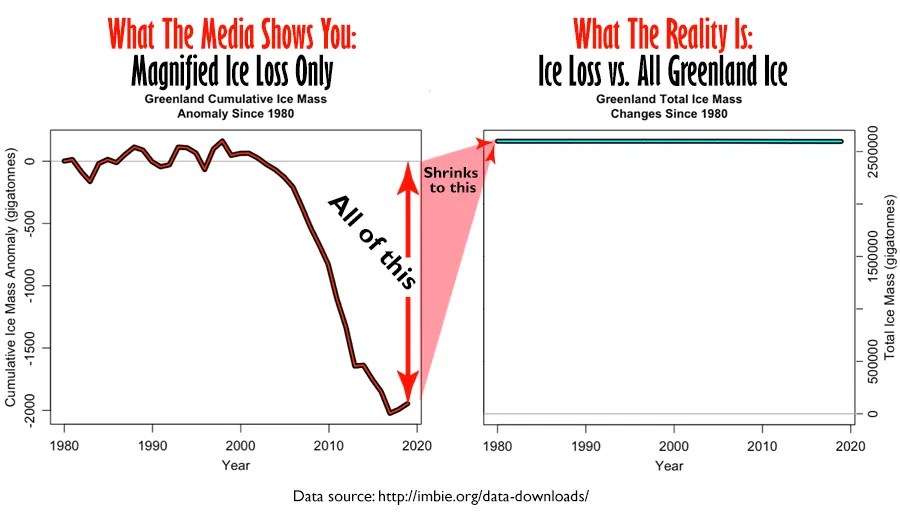
The same trick is used to report the melting of the ice caps. The left graph is shown to the public, suggesting significant ice loss, the right is the actual change.
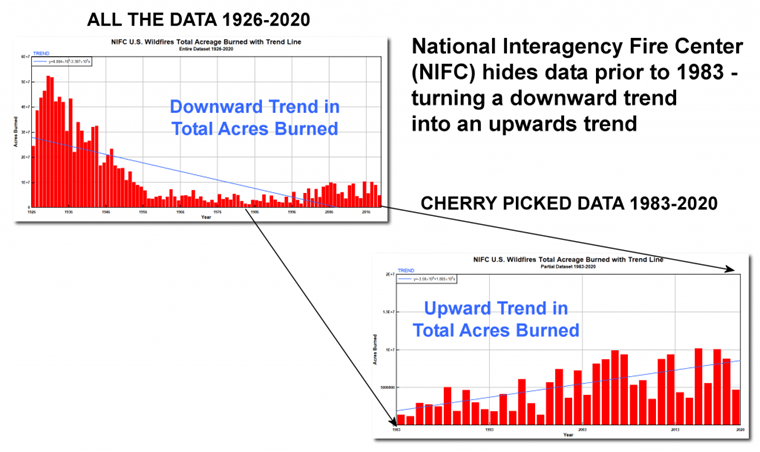
Cherry picking the data is also common. The graph on the left shows that wildfires declined greatly since 1926. The graph seen by the public, starts at the lowest point, to show an increase in fires.
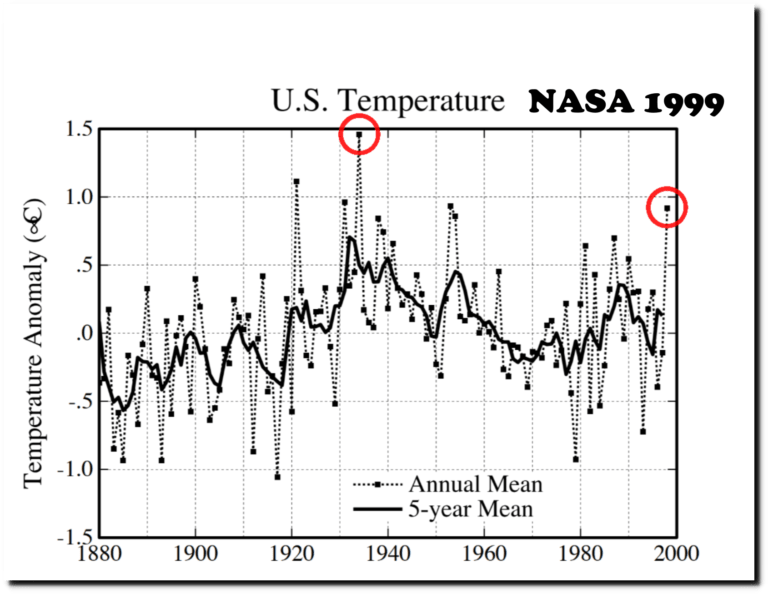
Yet another way data has been manipulated is by altering graphs to exaggerate the present warming trend. Below is US temperatures from 1880 to 2000, by NASA 1999. The 1930s were the hottest.
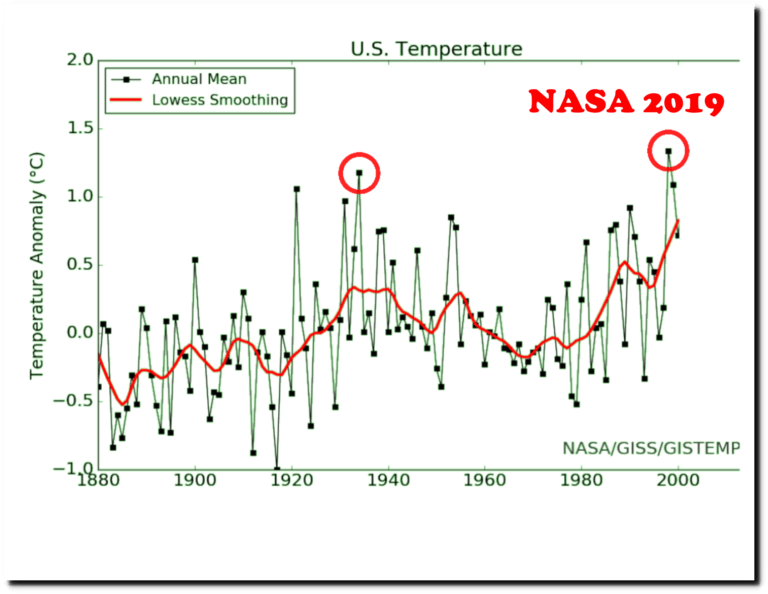
By 2019 the graph changed, showing 2000 being the hottest.
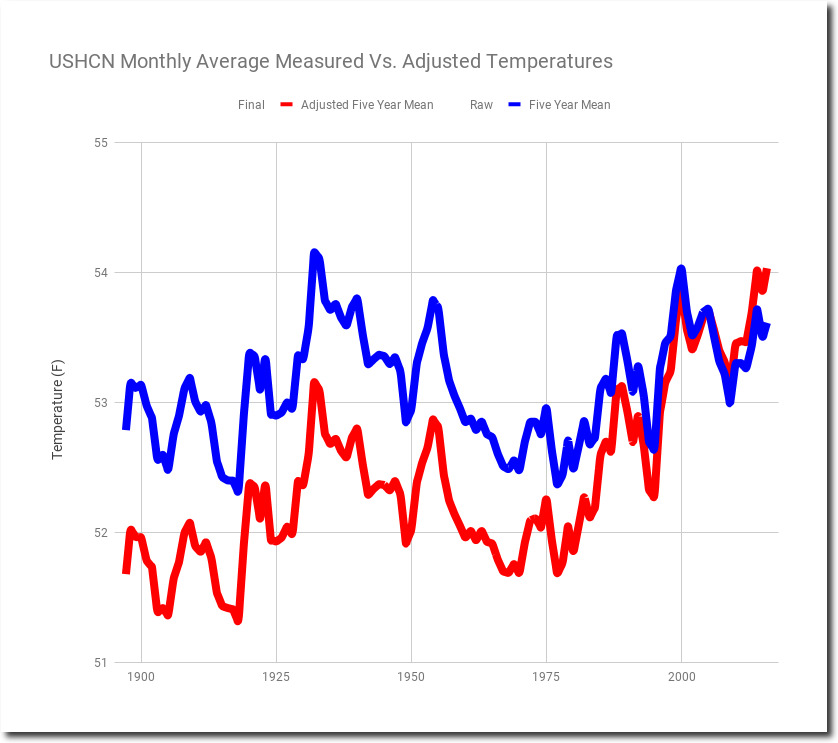
Here are both on one chart. The reported temperature depicts a sharp increase at the end, to make the present time appear the hottest. The actual, measured temperature correctly shows 1930s as the hottest.
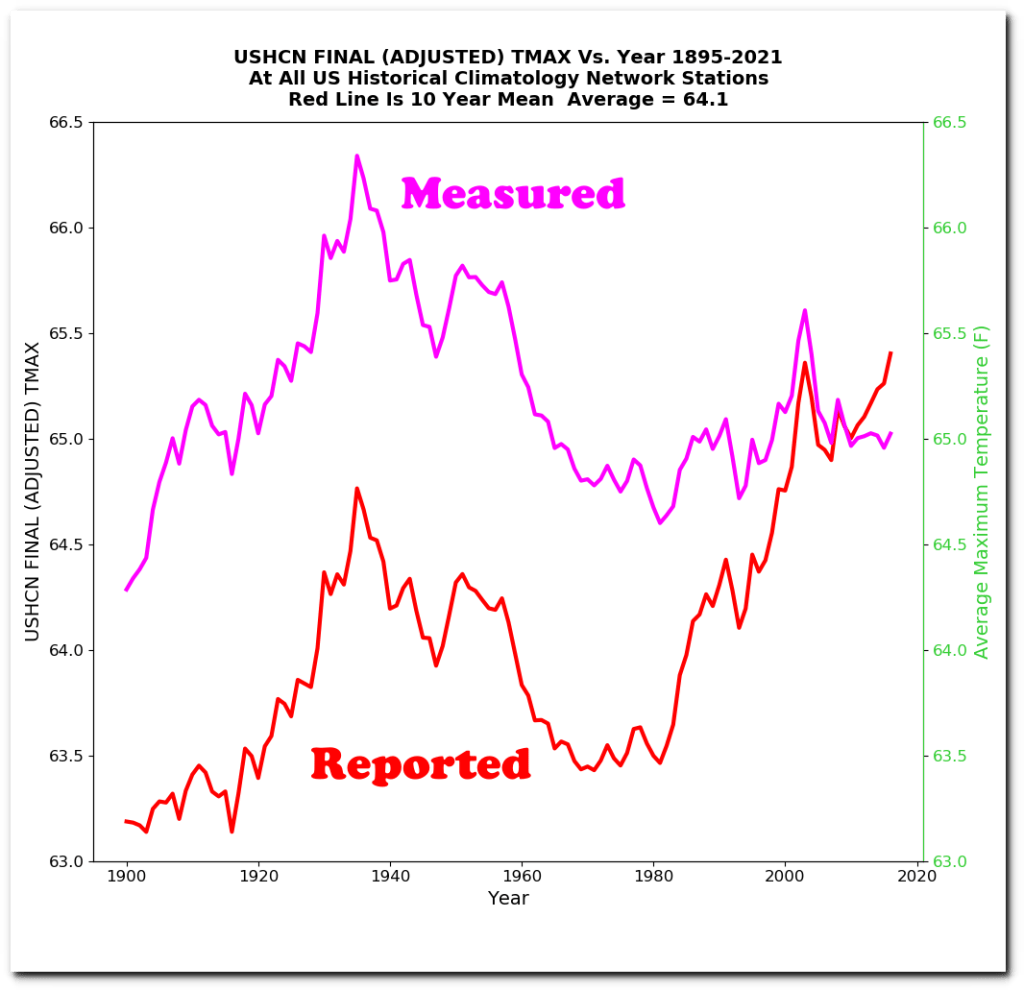
A different version of the previous graph, Measured vs. Adjusted. “Adjusted” means tampered with. If the average person did this, it would be called fraud and he would be prosecuted. But scientists, who are doing the globalist elite’s bidding and are protected by the media, get away with it.
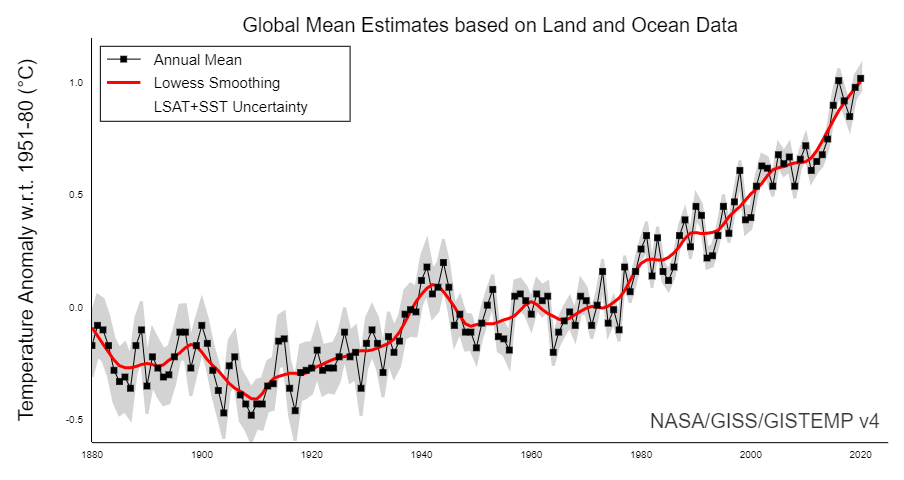
Global temperatures 1880 – 2020. This is the most often referenced chart in the world, (same in the feature image), depicting a sharp increase in global temperature over 140 years. It was “adjusted” to show a runaway trend, to support the “climate emergency” claim.
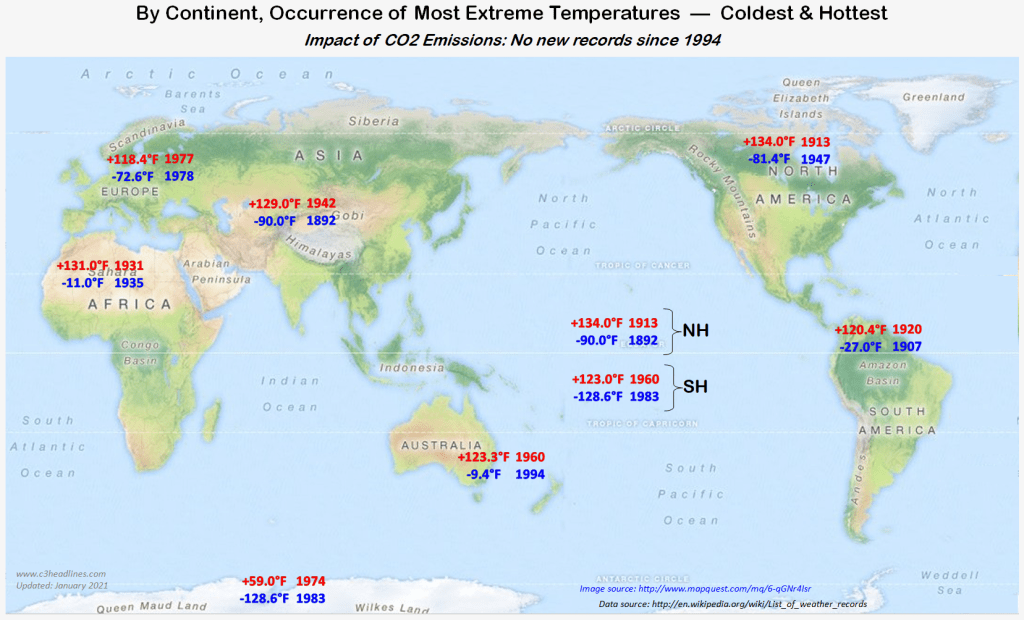
No hot temperature records have been broken in the world since 1977 and most were set earlier during the 20th Century. This is consistent with actual, measured temperatures, shown on the previous charts.
“What I’m showing you is the original data and what you are looking at is the data that has been tampered with by NOAA and NASA….. every year they put out a new issue and every year that are in the 2000 plus they get hotter because they tampered with the data” – Dr. Easterbrook
“The National Science Foundation, NASA and NOAA have manipulated the data? “- State legislator
“Yes, they have what they call adjusted data and if you look at how they adjusted it, the 1930s always get lower…. and the 2000 plus always get warmer.” – Dr. Easterbrook
Testimony by Professor Don Easterbrook, Washington University, before the Washington State legislature in 2013. Dr. Easterbrook is an environmentalist, with 55 years of experience in climate research.
It is recommended to watch the entire testimony, it is the best 90 minute presentation of real climate data.
Scientists can project future climate trends through climate modeling. It is a computer stimulation, that runs multiple scenarios for future conditions, like population, anticipated CO2 emissions and other variables, like wind, temperature and air pressure.
Most projections show that global temperatures will rise by 4 Celsius (7F) during the 21st Century. This is often cited by the media as evidence of a climate emergency.
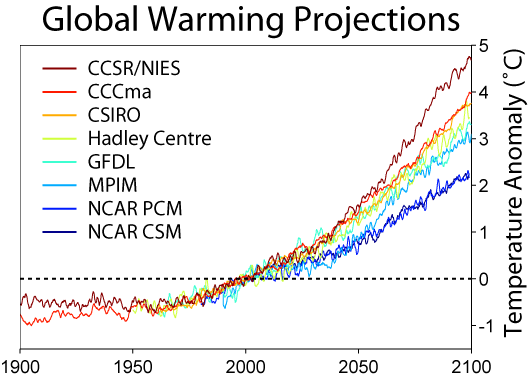
But climate models have many shortcomings, what comes out is fully dependent on what programmers put in, assumptions, hypotheses and personal bias.
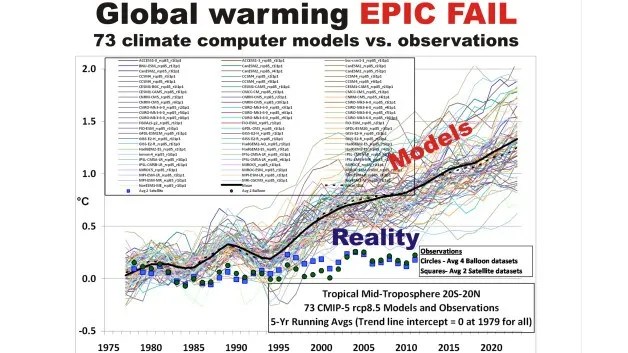
No less then 73 computer models projected a sharp rise in temperatures from the 1970s to 2020. All has failed, as the actual temperatures turned out far lower:
Scientists, who go against the popular opinion, are frowned upon. They risk losing their funding, which means losing their jobs, or it can end their careers. Thus, they are forced to conform to the narrative. Those, who do speak up are either retired, or are high profile and can not be “canceled”.
More info on data tampering: Real climate science
Read more: Do 97% scientists agree on global warming? | 130 Years of Failed Climate Predictions
